Introducing the diagnostic log
Diagnostic logging is the most advanced logging mechanism in RPM. We recommend changing these settings only if directed by a support staff or development team member. And once your issue has been resolved, we recommend resetting it to the default values.
We added diagnostic logging to RPM in 2014. We had several goals in mind:
- turn logging on and off for specific parts of RPM
- produce a more detailed log than the event log or message log
When we start the program, we erase empty log files and ensure that there are no more than seven diagnostic log files for this program. This way, you don't need to be concerned about log files consuming your disk, assuming you don't go heavy on the logging and don't run the codes for months.
Diagnostic logging exists because we needed to find ways to document what specific parts of RPM were doing at a given time.
By contrast, the message log is a summary statement of something that happened, and the event log is more of a status log.
I've had people look at the diagnostic log and tell me it doesn't show any errors. My response to that is it often doesn't report a fault but is more useful for what it does say and what should be there but isn't.
What we do with the diagnostic log
Typically, RPM and other programs we distribute create a diagnostic log each time they run. By default, we configure the log to produce enough information that our technical staff can verify basic functioning.
To diagnose a problem you may be having, the technical staff may ask you to configure your diagnostic logging to track more settings. How to do that is explained below.
Usually, you would make those changes, restart the RPM service, reproduce the problem (or wait for the problem to happen again), then stop the service and send us the logs via email.
Once we (together) resolve the issue and you're back to standard processing, you should first clear the diagnostic log settings, except the defaults. We'll show you how to do that.
There's not a good reason to keep the settings on "just in case" if the problem is fixed. It just makes processing take longer and consumes a lot more of your disk space.
Note of warning
If you turn on every diagnostic log setting, we can almost guarantee that RPM will run very slowly, or not at all. Please do not do this.
How to configure the diagnostic log
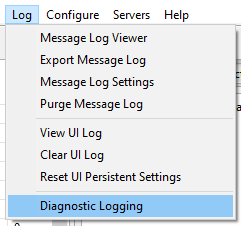
In the user interface, go to the Log menu. Select "Diagnostic Logging" as shown in the image here:

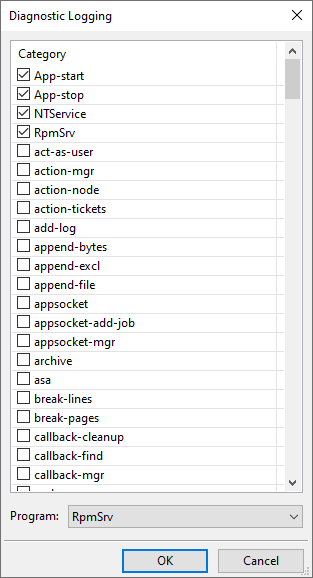
Next, you should see the Diagnostic Logging form for the RPM program, as shown here:

Note that the four settings at the top are selected. These are the default settings. We'll come back to those later when it's time to reset.
Please note that some settings on this form will slow RPM down severely, so please don't experiment.
At the bottom of the form, note that it says "Program:" with RpmSrv as the selection. You can use this same form to change the diagnostic log settings of other programs distributed with RPM.
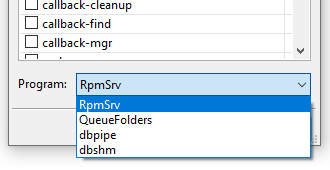
Click the program list to see the following:

The program list shows RpmSrv as the current selection. You can also configure the settings for the QueueFolders program and the two programs we use to interface with the Firebird database, dbpipe and dbshm.
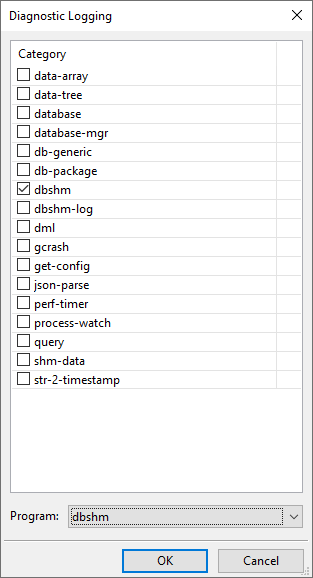
Let's say you selected dbshm. You would get something like the following:

The form shows the diagnostic log settings for the dbshm program. We don't expect you to look at this form or change anything. For my purposes as a developer, I usually have the "dbshm" setting selected, but that is because it makes sense for my job. It probably does not matter for your environment.
Once you have finished, click the OK button to save this configuration.
After this, you may need to restart the service. RPM will receive a notification that the diagnostic log settings have been updated. Some parts of RPM run from start to finish and don't process the change in diagnostic log settings until the program restarts.
What to do with the log when you have one
For the sake of this explanation, I've gone to my RPM install folder, "C:\Program Files\Brooks Internet Software\RPM" and did a directory command for "rpm*log"
These are my results:
 Directory of C:\Program Files\Brooks Internet Software\RPM

04/28/2020  04:27 PM            16,279 rpmsrv-20200428-161336.log
04/28/2020  04:27 PM            16,278 rpmsrv-20200428-162706.log
04/29/2020  07:13 AM            16,320 rpmsrv-20200428-162932.log
04/29/2020  07:35 AM            16,320 rpmsrv-20200429-071356.log
04/29/2020  09:14 AM            16,319 rpmsrv-20200429-091303.log
04/29/2020  02:12 PM       281,190,404 rpmsrv-20200429-091805.log
04/29/2020  03:20 PM            21,423 rpmsrv-20200429-151936.log
               7 File(s)    281,293,343 bytes
               0 Dir(s)  234,191,331,328 bytes free
Note that I did an extensive experiment earlier this week. The files with a size of 16K are typical for an RPM diagnostic log file with only the defaults set.
Usually, if you have selected some diagnostic log settings and run RPM until you get the desired results, you'll have a large file. These are text files, and they compress very nicely with a file compression utility such as zip or 7z.
Email one or more of these log files to our technical support staff.
How to get the log back to normal (minimal logging)
- In the user interface, go to Log / Diagnostic Logging
- Make sure the top 4 settings are selected
- Make sure all the other settings are off; scroll down to check.
- Click OK to activate these settings and to store them.
What are the default settings in the log
These are the default settings:
- App-start, App-stop, NTService, RpmSrv
Note that these used to be lowercase. That changed in one of our recent updates to diagnostic logging to make it easier for customers to track and for us when we connect to your system.
It's helpful to us to have these settings on. The log file RPM creates is around 16K bytes, which by modern standards, is tiny.
In the dbshm and dbpipe configurations, I have "dbshm" and "dbpipe" selected, respectively. We do not expect you to do that.