We have worked with several customers who report that they receive jobs very slowly using RPM Remote Print Manager® (“RPM”). This is always a surprise to us because when we test RPM features and fixes, we have several folders containing a total of nearly 28,000 files. That is our basic, everyday test base. We use the pylpr program that we ship with RPM
Just now I sent 27,905 jobs on my workstation to RPM running locally in 296.4 seconds, which comes out to roughly 94 jobs per second. This is based on the database entry that timestamps when the job arrived. I subtracted the first from the last.
So, naturally, when someone reports super slow receiving or processing, we want to know why. We have identified several contributors to this problem; there may be more; I wish I could say we now know everything, but not yet.
Network probe
We were able to request a diagnostic log from one of the customers who reported this problem. We have a variety of tests we can ask for, including networking in general and one specific to the LPD protocol the customer was using.
To our surprise, this log showed that with every print job RPM was also receiving an “lpstat” request. It’s sometimes called “lpq” and means, send me a list of the jobs RPM has received for a given queue.
The problem is that RPM wasn’t handling these requests correctly and ended up keeping the network connection open. We fixed that immediately, of course. We saw from the log that when they shut down RPM, over 600 of these connections closed.
Once we fixed that, the customer reported that the problem was solved, and never happened again.
We made this fix in RPM update version 6.1.0.461 dated 2017-10-26. If you are using that version or earlier, you should update your RPM version as soon as you are able.
In order to find your current RPM version, run the user interface and look at the very top of the UI window. The version follows the product name:

High detail logging
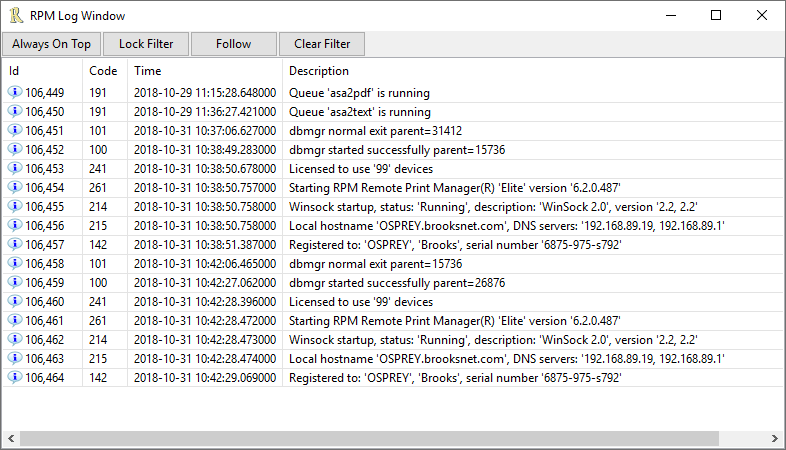
We have several types of logging in RPM. You can see the log this way: in the UI go to Log / Launch Log Viewer:

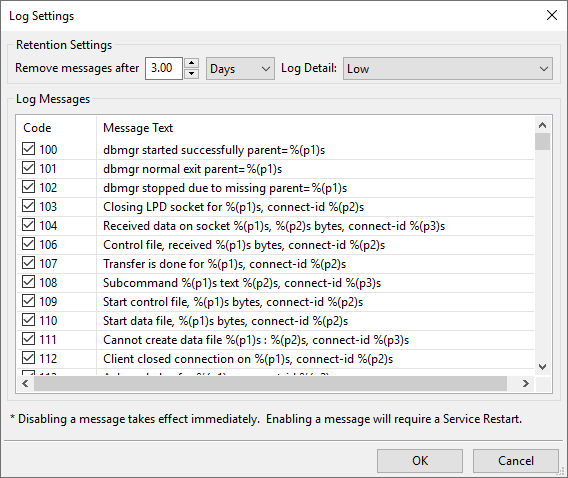
This is the message log and it’s the latest version of the original log RPM maintained. RPM logs in varying levels of detail. To set the log detail you would go to Configure / Log Settings:

Note the retention settings at the top of this form. The default is to keep 3 days of logs and to log at a Low level. The other options for detail are High and Minimal.
This has always seemed easy enough for people to figure out and use. And we have always accepted that if you log at high detail, it slows RPM way down. Logging at high detail is like a “necessary evil” in order to get insight on a problem. Once that is done, you normally would want to switch back to Low detail.
What we didn’t realize is this: the person who wrote this code added the “log cleanup” logic after every log message insert. That’s a lot of unnecessary work to do each and every time, and it’s not fast. Not only do you have to fetch the settings and calculate the cleanup period, but you then force a scan of the messages to remove the old ones.
If you logged at low detail you might not ever notice this extra work but it turns out that logging at high detail was very slow, for exactly this reason.
At one point we set out to improve the logging speed and found this. Removing that cleanup made logging dramatically faster, even at high detail. We also added the logging to a background task so the impact on any process should be minimal.
We made this fix in RPM update version 6.1.0.471 dated 2018-02-21. If you are using that version or earlier, you should update your RPM version as soon as you are able.
In order to find your current RPM version, run the user interface and look at the very top of the UI window. The version follows the product name as shown in the UI snapshot above.